
Just How Much Margin Does Your Transport Company Leave on the Table?
- In very stable environments the under-earned cash margin is nearly 3% of sales due to lack of appropriate (intelligent) pricing.
- In a more volatile environment, such as post-Covid, transport companies under-earn more than 10% of sales as a margin.
- Even without Covid, volatility in demand is large enough (5%-10%) to translate into under-earned margins of 4-6%.
Are we leaving cash on the table?
Managing the margins in an exceptionally volatile environment is a headache. Things may have appeared simpler before the Covid: costs and demand were more stable. Margin management was just an issue of squeezing out marginal operational efficiencies.
But even in the pre-Covid period transport companies left the main tool for managing margins underused. In our pricing discussions with managers, the very first reaction is usually the same: “we have been doing this for a long time, we know our customers”. But then comes the difficult question: “Do you think that you would lose the quote if you increased the price by 2%?” How about this one: “Would cutting your price by 2% increase the volumes such that your gross cash margin would be higher?”
This is when most managers confess that they may be leaving some margin on the table. But just how much margin is under-earned in the pre-Covid era? And how bad does it get in the post-Covid volatile environment?
Is the price right?
Let’s consider as an example a single European road route carried out by a hypothetical company – XY Logistics. Currently, XY prices the route at €720 and the regular volume is ~670 shipments a year.
Clearly, increasing prices for spot quotes and for tenders that come to renewal would impact the volume. But if the impact of loss of volume is smaller than the benefit of higher price, the increase would be justified. As prices increase, the loss of volume is small, but then the higher prices go, the volume loss accelerates. This means that there is a trade-off between prices and volumes that strikes the best margin (by the way, this price is different from the price that strikes the highest revenue).
As a next step, XY hires a consultant to increase the margin, who benchmarks the prices with external data and finds that the company prices below the market, which is at €800. The volume does decline by about 25% from 667 to 500 trips, which could be considered as a disaster. Assuming the company’s recently calculated costs for the route are € 600, the cash margin however increases (800 – 600) x 500 or €100,000 compared with € 80,000 (Table 1).
Table 1: Price, volume, cash margins and revenues
| Price | Volume | Margin excluding fixed costs |
Cash margin including fixed costs |
Revenues | Margin as % of revenues |
| 720 | 667 | 80,000 | 46,667 | 479,999.93 | 9.7% |
| 770 | 565 | 95,985 | 52,447 | 434,756.70 | 12.1% |
| 800 | 500 | 100,000 | 50,000 | 400,000.00 | 12.5% |
Of course, decrease in volume has its penalty: XY still has to pay interest on leases and other fixed costs. Assuming those fixed costs are € 100 per missed trip, we get a more realistic cash margin improvement of € 52,500 from € 46,700. This is an increase in margin (as percentage of revenues) of 2.8%!
The development of margin is easier to visualize in the graph (Figure 1). Note that the market price does not mean the highest cash earned from the transaction. The highest cash earned is at € 770, when the volume is only ~15% lower. In general, pricing closer to the market (triangle in the graph) does not guarantee the highest cash margin. Also note that raising the prices does not always result in better cash margins.
Figure 1: Cash margin including fixed costs depending on the price, data labels show the price and corresponding cash margin, the full circle is the pricing that delivers the highest cash margin, the triangle points at the market price and the empty circle is the assumed current price. Source: ClearD3 calculations
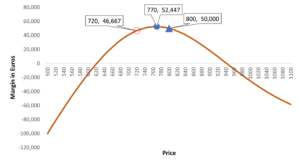
So, in a perfectly stable market environment, XY Logistics could increase its margins by nearly 3%! Is this realistic? Is there sufficient pricing flexibility in a stable market to generate such a margin. It turns out yes: according to pricing data from TI/Upply/IRU pricing benchmarks for European transport, on an average route the range of most “reliable” quotes have a 12-15% gap. That means that for any customer quote, the lower end and higher end of the reliable providers is 12-15% apart. This is greater than the ranges we discussed in the example.
Is there a demand change we are not aware of?
The margin left on the table is much greater when the market is volatile. Assume, for example, that an external event drives the demand higher by 15-20% (example: the Covid squeeze). In the first few months, XY Logistics keeps on pricing based on the historic costs, until its own costs begin to increase. The volumes increase gradually, but the company does not increase prices just yet.
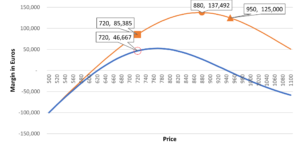
Unfortunately, most companies do not have external data and systems in place to realize that they face an increased demand (Figure 2) and a new margin curve (learn how ClearD3 gauges these market shifts). While the company still charges the € 720, the volume increase helps lift the revenues and margins from € 46,600 to € 85,400. However, the new best price level is € 880, while the cash margin is € 137,500, or € 52,000 higher! This is about 11% (of sales) increase in the margin.
Figure 2: Cash margin including fixed costs originally and after the increased demand, Source: ClearD3 calculations.
So how much margin is under-earned in an average year?
It is tempting to say that the Covid-driven market volatility is one-off, that soon we will return to the normal stable markets. But even in the normal pre-Covid period, changes in end-market capacity utilization and volumes are large (Figure 3). What this graph suggests is that in an average year there is a good chance of a change in demand by 5-10% either way.
Figure 3: Change in capacity utilization compared to the average, Euro Area, Source: FRED, ClearD3 calculations
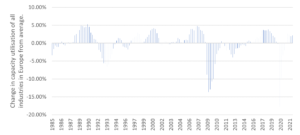
Based on our calculations, by ignoring this in the pricing phase, transport companies currently earn 4-6% less gross margin than they otherwise could with exact same assets. They also create capacity stresses and shortages, while the most loyal customers have to be turned away or put on hold.
Complementary forecasts for the end markets of freight transportation & logistics companies in Europe
to add value in making pricing and capacity decisions at your company.