
Rebooting the Data-driven Revolution in Freight Transport
by: Rob van Doesburg, Founder, Transport Improvement
Taron Ganjalyan, Managing Director, LINKS Analytics / ClearD3
Introduction
Decision-making backed by data evidence promises to unlock incredible gains in the freight transport industry. Internet of things, blockchain, autonomous vehicles and advancements in sensor technologies have already begun to generate significant amounts of (BIG) data. The conventional wisdom in this field is that all it takes is unleashing groups of data scientists on the data, and valuable insights will start to flow to the management, supporting decisions and making financial contribution.
Unfortunately, the reality turns out to be different. According to Gartner analysts (Asay, 2017), over 80% of data science projects in all industries, including transport and logistics, never make it to production. A similar number (87%) is reported by VentureBeat (VentureBeat, 2019). The financial impact of the implemented projects is also arguable. What is the reason for such an appalling outcome?
When it comes to data projects, the conventional wisdom is flawed and a course correction is required to deliver the promised financial upside. The whole process needs to be restructured, but the primary focus should be on the two main problems: the problem definition and the impact assessment.
Data-driven decisions or decision-driven data analytics?
By far, the most important part of data projects that is “mishandled” is the problem definition. Companies have started to accumulate a lot of telematics data, which then can be enriched by sensor readings from inside the tank containers, minute details of the network state etc. The common process of data projects is then to pass this data to the data science team for analysis. The question is – analysis of what exactly? At best, a vague question is posed, the answer to which is impossible to find in the available data.
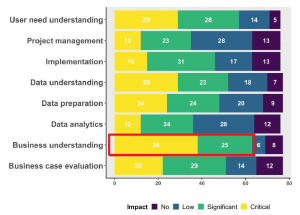
A recent study based on a survey of 112 managers involved in data projects (of which 30% in transport & logistics) indicates that the majority of data projects “fails to create business value”. A top reason for that is cited as lack of “business understanding” (Ermakova, et al., 2021). Business understanding, along with the second most common reason for failure – “user need understanding”, are part and parcel of poor problem definition.
Figure 1: Impact of different factors on lack of success, Source: (Ermakova, et al., 2021)
Data analytics should begin with the right questions. When it comes to transport companies, almost all data are currently internally generated and highly specific to the own network operation, which limits the data projects to internal problems – those of cost and quality. To be clear, these are important goals, however, they are nowhere near the most important drivers of the financial performance.
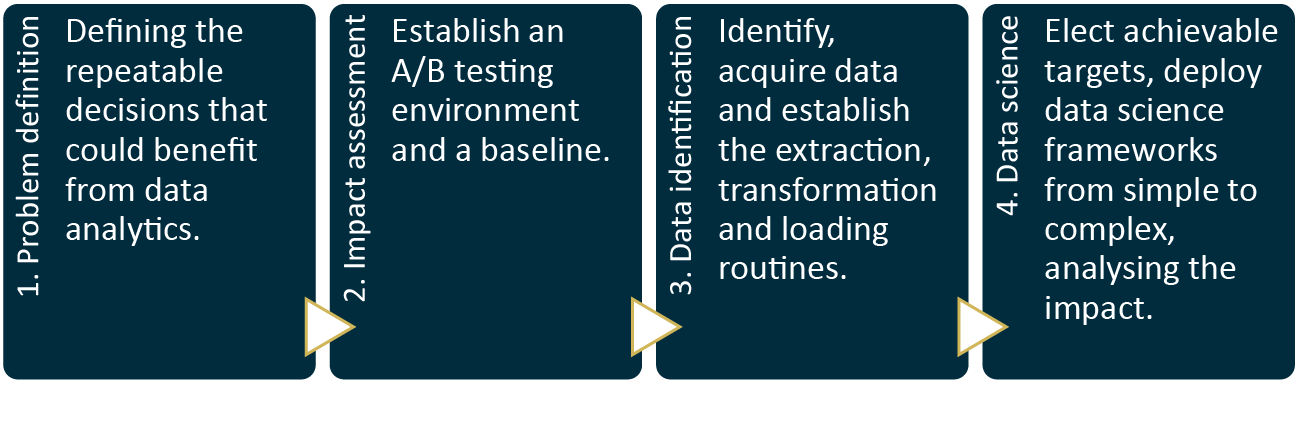
A more appropriate process for data transition follows the decision-driven data analytics path (Figure 2).
Figure 2: The decision-driven data analytics process
Spending more time in the problem definition phase will mean less wasted resources on unnecessary, low impact or unlikely to succeed projects. There are plenty of manual processes in transport companies that could benefit from automating and streamlining. The question is whether all of them need to be a priority?
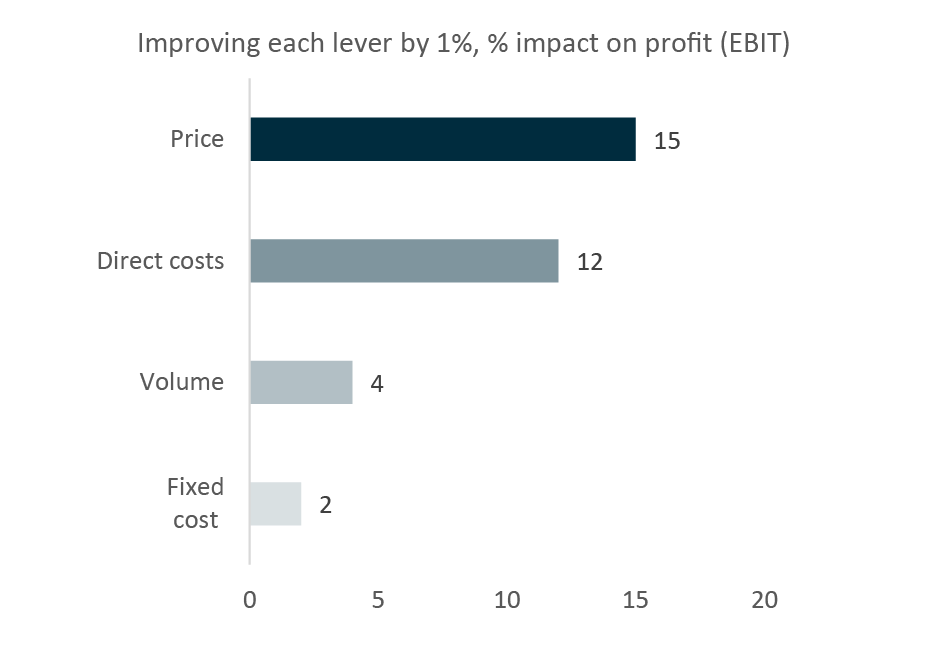
A good place to start the process is an audit of the most impactful decisions made in a freight transport company. According to a study by McKinsey (Figure 3) (McKinsey, 2020), the primary driver of the operating performance for transport and logistics companies is pricing. A single percentage point improvement in pricing increases the operating profit by an average of 15%. In contrast, a percentage decrease in fixed costs increases the margin by only 2%. Yet, much of freight transport data projects are targeted at cost management.
Figure 3: Impact of 1% improvement (increase for price, volumes, decrease for costs) in Income Statement line on the operating income. Source: (McKinsey, 2020)
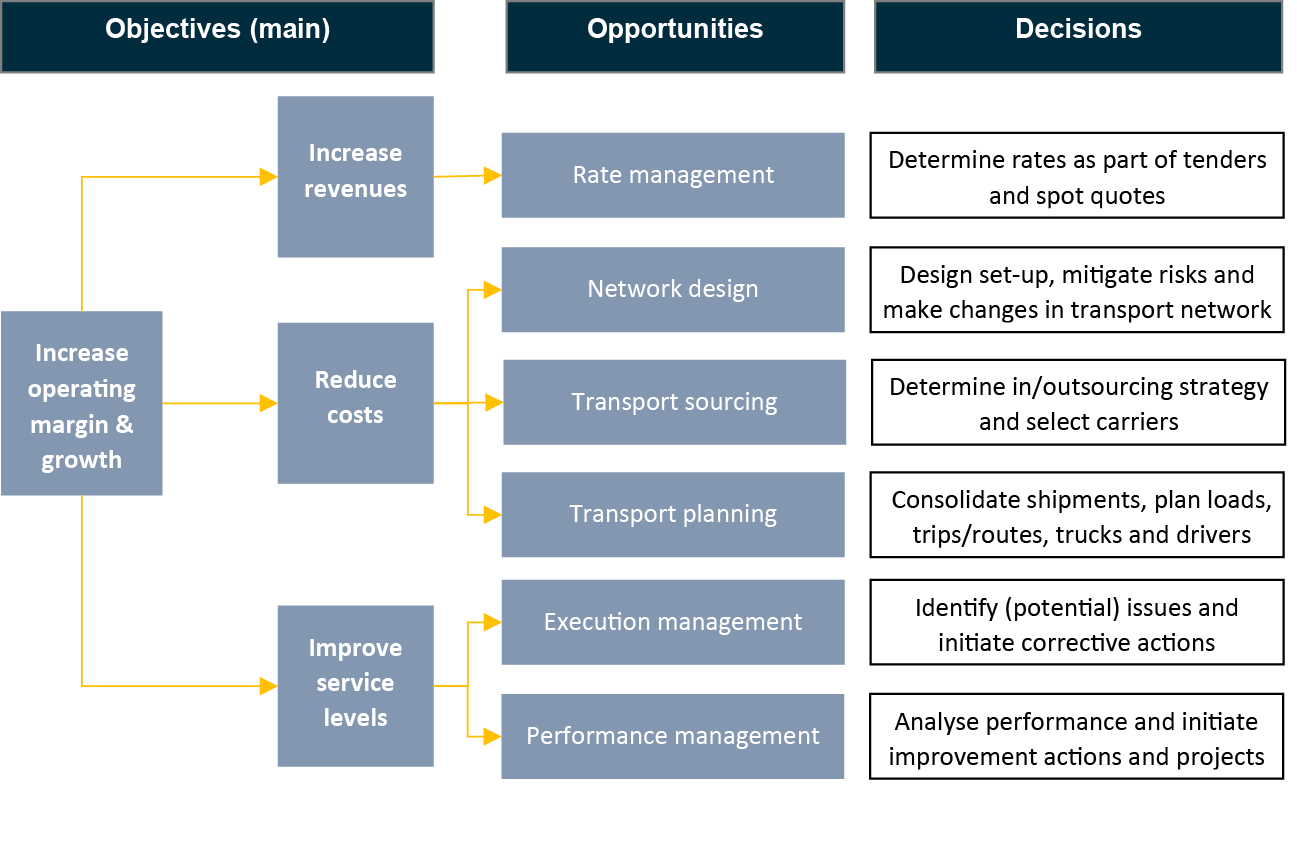
We group these income statement lines into three strategically important areas for data-driven improvements to have a tangible and significant impact: increasing revenues, reducing costs and improving service levels, each linked with one or more opportunities for data-analytics (Figure 4).
Figure 4: Opportunities for problem definition for data analytics projects in freight transport
Not all decisions/opportunities are of course created equal. As mentioned earlier, some (like pricing) have much larger financial impact than others. Importantly, some decisions may not benefit from fully automated decision-making; for instance, the investment in trucks and other assets, while supported by data, requires one-off expert assessment. The benefits from automation of insights are achieved only in case of many, repeatable and small sized decisions, such as pricing or trip planning.
Each of the opportunities in the company must be carefully considered with respect to the potential for automation and impact on margins and growth. The feasibility of each project can be compared with its remaining financial impact. Transport planning for instance, has been at the heart of automation and improvement for freight companies since 1990s. There is less remaining financial upside here, while the feasibility of any additional improvement depends on access to additional external data from industry partners that is hard to get.
We ranked the data-driven decision opportunities based on feasibility and remaining impact on the operating margins (see figure 5).
Figure 5: Data-driven decision opportunities ranked based on feasibility and remaining impact on the operating margins, Source: LINKS analysis, TransportImprovement.com analysis
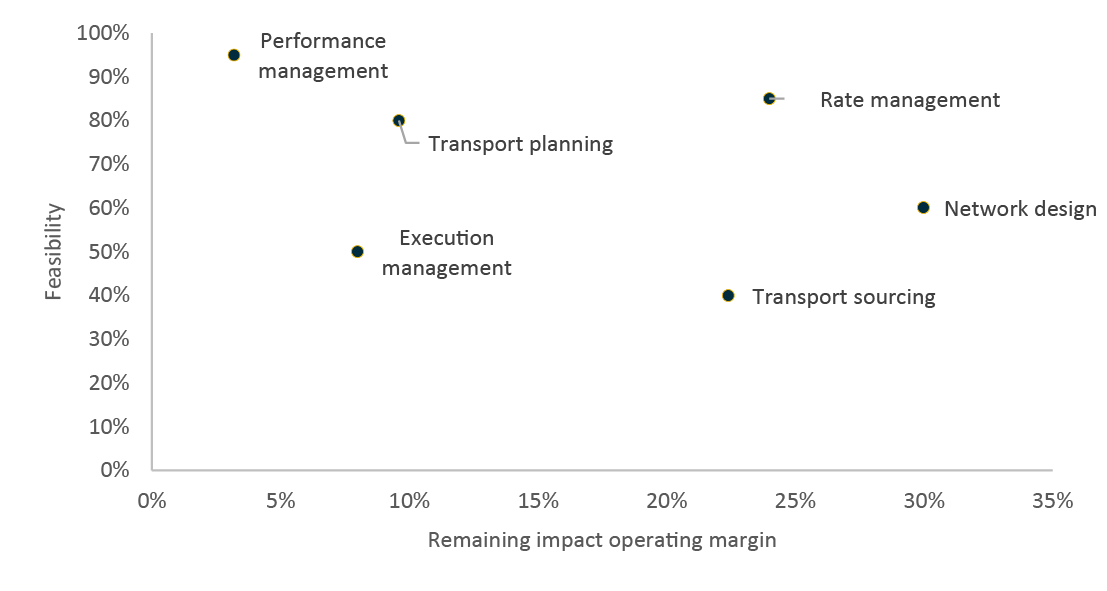
In particular, in areas like rate management, network design and transport sourcing, the impact on operating margins of improved decision-making can be very large and quite feasible to achieve compared with other areas.
Rate management
Customer revenues of logistic service providers (LSPs) are based on a long-term baseload of contracted volumes and a more volatile, potentially higher-margin load of spot volumes. The duration of contracts with customers varies from mid-term (1-3 months) to long term (>3 months). The mix of contracted and spot volumes depends on the transport mode.
To maximize profit, LSPs need to make decisions regarding:
- The mix of contracted volumes and spot volumes and duration of contracts;
- The rates and terms and conditions of contracts for new customers or renewal ofcontracts for current customers;
- The rates to be used for spot quotes.
Traditionally, decisions on rates are based on a cost-plus approach and, in case of contract renewals, on discounts based on historical prices. More recently, concepts based on value pricing and forward-looking cost-catalogues are being used by LSPs. For spot pricing, dynamic pricing in line with the utilisation forecast and expected demand is a best practice from other industries, something which LSPs aim to implement.
The implementation of these new concepts depends on the availability and quality of data to be used:
- Costs of basic and additional services (by customer);
- Market volumes and current and expected market rates per service/lane;
- Current and expected future shipment volumes per service/lane including seasonalpattern;
- Current and future capacity per service/lane.
Forecasting the future capacity, costs and expected shipment volumes will be critical to implement these new concepts successfully.
Network design
For smaller shipments, logistic service providers are using systemized transport solutions based on hub and spoke networks. Examples are groupage networks and fixed milk runs in road transport, LCL shipments in sea transport and parcel networks.
To optimize operational costs, decisions are needed regarding the set-up of these networks:
- optimal number and location of terminals/depots;
- allocation of pick-up/delivery points to these terminals/depots;
- the service/network used for a specific customer and shipment.
LSPs support these decisions by evaluating and fine-tuning different scenarios regarding the network set-up and finding the right balance of service (lead-times) and costs of transportation and handling at terminal/depots. The necessary calculations are made in Excel or other dedicated network optimization tools.
The quality of the outcome here depends on the capabilities of staff involved (regarding definition of scenarios, collection of data, tool usage and evaluation/presentation of the outcome), functionality of the tool and availability and quality of data. Master and transactional data need to be provided by internal and external sources, e.g.:
- network set-up: pick-up/delivery locations and terminal capacity/costs;
- transport means: truck/container types and related transportation capacity/costs (perlane);
- shipment details: pick-up/delivery time windows, dimensions, weights, etc.
Transport sourcing
Most logistic service providers (LSPs) use a mix of their own fleet and subcontracted carriers for the execution of their transport services. Subcontracting of carriers will be done for a specific service and period (‘contracted services’) and/or each shipment separately (‘spot quotes’).
To meet agreed service levels with customers and optimize operational costs, LSPs need to make decisions regarding:
- The mix of own fleet, contracted services and spot quotes;
- Investments in trucks and hiring of drivers for own fleet;
- Which carriers to use for the subcontracted services.
These decisions are typically made periodically, at least as part of preparation of the budget for the coming period. The starting point is a forecast of expected volumes per service type and the capacity of their own fleet when no changes are made. Additionally, the in/outsourcing strategy will play an important role.
The strategy will be based among others on market expectations regarding availability of truck capacity and drivers, as well as related costs. A quantitative analysis is currently carried out by the finance team to support these decisions by evaluating different options regarding the in/outsourcing mix, based on expected investments and costs of their own fleet and costs of subcontractors. These repeated decisions can benefit significantly from a structured forward- looking approach with clear decision performance assessment.
The quality of the outcome of the analysis depends on the availability and quality of data to be used:
- Current and future shipment volumes per service/lane, including seasonal pattern;
- Current and future capacity, investment and operational costs of own fleet;
- Current and future capacity and operational costs when subcontracted.
When forecasting labour and fuel costs, selecting the best carriers for the outsourced services and forecasting the availability of capacity and rates of the spot market can be done using Machine Learning methods to augment incomplete data.
Another major “battlefield” of data transition, going forward, will be in the customer experience-related areas like order and execution management: providing a seamless online experience of request-to-quote-to-contract. Although this will require a significant amount of external data, the required data are more readily available and the advanced machine learning, pricing and customer experience automation systems are available even for very complex use cases. Detailed simulation models of the transport network using real-time data and snapshots to forecast supply chain dynamics (a ‘Supply Chain Digital Twin’) will be an important enabler for data-driven decision support in other areas, since this will create better insights in actual and future capacity usage.
Objective impact assessment
Claims of big revenue or bottom-line impact sound hollow to managers. This scepticism is based on their experience; most managers have seen how difficult it is to accurately assess the performance of an isolated analysis, particularly when it comes to the impact on costs, revenues and profitability.
“Given sufficient data, anything can be proven” is a typical mantra demonstrated by this remarkable correlation between the number of people killed by venomous spiders and the number of letters in spelling bee winning word for the year (Figure 6). Just as in this case of completely random correlation, company’s profits could improve following the implementation of a decision-making process. Can the managers objectively conclude that the profitability was driven by the decision-making tool, or could there be many other reasons for improved profits?
Figure 6: An example of random correlation of historical data, Source: tylervigen.com

The problem of objective impact assessment is critical, particularly since great results are achieved through trial and error. This means repeatedly trying a new decision process, seeing the result and adopting it if the result is better. How can managers improve data-driven decision-making, if in the first place it’s not clear what the objective impact was?
The “gold standard” of solving the problem of “does something work?” is the randomized experiment, also known as randomized controlled trials (RCT) or A/B testing. If a company wants to test a particular product pricing algorithm, for example, all requests for proposal or opportunities are randomly assigned to one of two groups: A or B. The algorithm is used in group A and not in group B, without sales peoples’ knowledge1. If the profits or revenues in group A are then materially better than in group B, the decision-making approach works. This way, “the knowledge gained is likely to outperform traditional ways of evaluating policies, like dogma, folklore, charisma, conventional wisdom and HiPPO (highest-paid person’s opinion)” (Pinker, 2021).
Establishing the infrastructure for RCT (or A/B testing) must be done ahead of any new data project implementation in order to be able to test “without contamination”, i.e., as objectively as possible. The desired or projected business objectives of each data project need to be articulated:
- “We want to achieve 2% superior revenue growth”;
- “We want to get 5% cost savings”;
- “We want to have 3% better gross margins”.
The goals must be set in such a way that A/B testing results are able to serve as evidence whether the goals were achieved or not. In a dynamic pricing project, for instance, revenues, win rates, margins and many other variables can be calculated and compared across test group A (where the decision approach is applied) and test group B (where the decision approach is not applied) (Figure 7).
Figure 7: A/B testing approach applied to pricing quote requests for freight transport
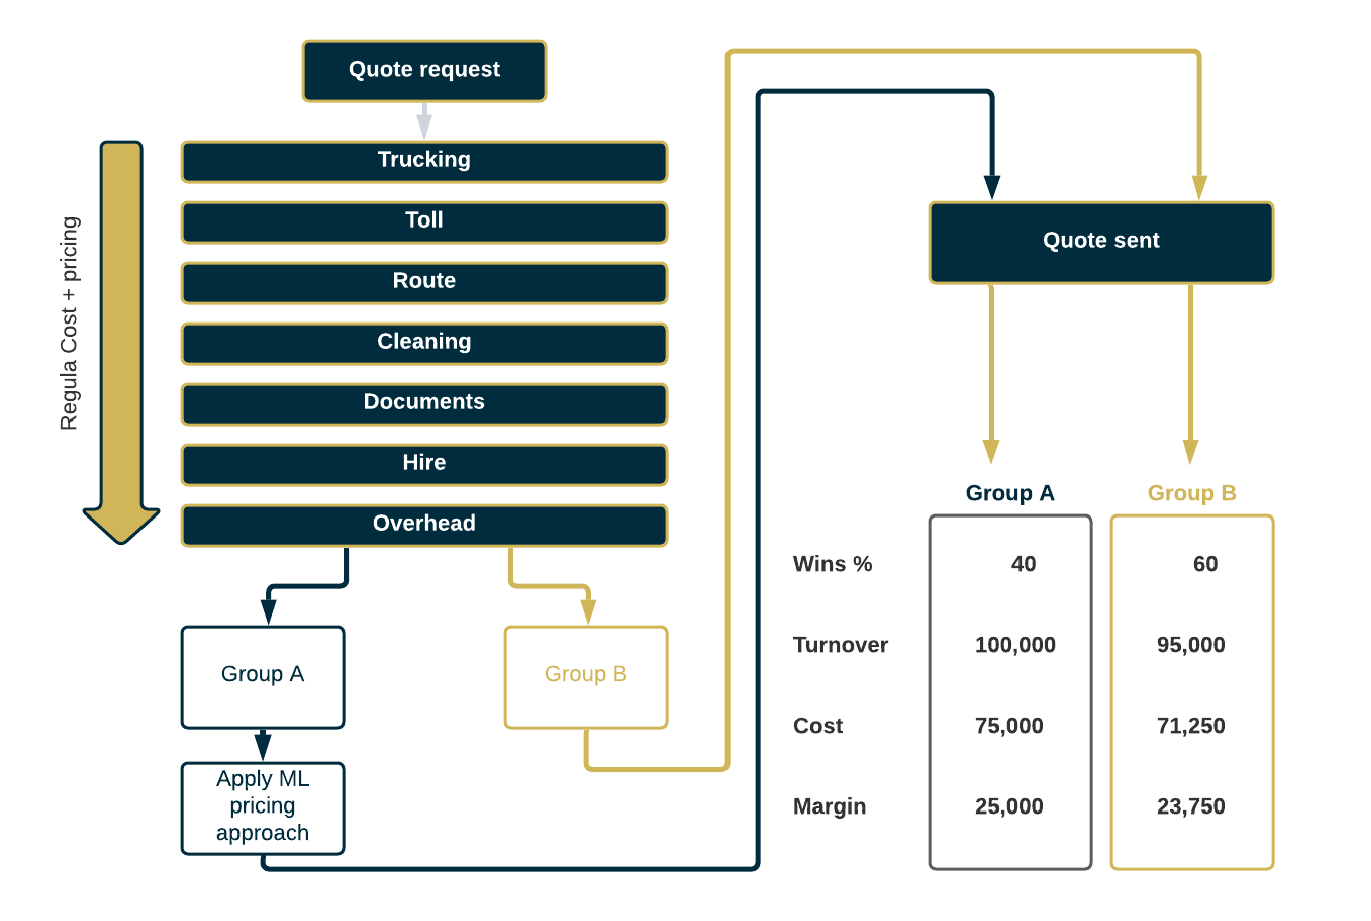
Implementation of A/B testing in the freight transport industry is fully automated: a simple integration with the CRM (customer relationship management) software and/or ERP/TMS is carried out, depending on the workflow of the company. The automation ensures that the selection of quote requests for “experiments” is random and unbiased – independent of the managers and employees.
Once such a “Test Lab”, as it is called in ClearD3™, is in place, the company can begin testing various small data-driven projects with a standardised metrics and requirements and an ability to quickly zero in on those projects that make a considerable financial contribution.
A similar approach can be used for other opportunities like network design and transport sourcing. A data-driven decision approach will directly impact the availability/quality of forecasts, and indirectly – the scenarios/options to be considered. Here A/B testing philosophy can be used by comparing the cost impact of the scenario/option selected based on a traditional analysis with the outcome of the data-driven approach.
Conclusion
A pragmatic and measured approach is essential for realising the large financial gains promised by data. Being strategic about data projects does not require a wholesale transformation of the organisation into a technology firm – something that is neither possible nor desirable.
Instead, it is important to stick with a few simple key principles when allocating capital to these projects:
▪ Define the problems with the greatest impact on profits and/or growth;
▪ Establish a fully integrated A/B testing environment to assess the success;
▪ Take on small, manageable projects, test, assess the impact and select the winners.
References
Asay, M. (2017, November 10). 85% of big data projects fail, but your developers can help yours succeed. Retrieved from TechRepublic: https://www.techrepublic.com/article/85-of-big- data-projects-fail-but-your-developers-can-help-yours-succeed/
Ermakova, T., Blume, J., Fabian, B., Fomenko, E., Berlin, M., & Hauwirth, M. (2021). Beyond the Hype: Why Do Data-Driven Projects Fail? Hawaii International Conference on System Sciences.
McKinsey. (2020, December 8). Getting the price right in logistics. Retrieved from mckinsey.com: https://www.mckinsey.com/industries/travel-logistics-and-infrastructure/our- insights/getting-the-price-right-in-logistics
Pinker, S. (2021). Rationality: What It Is, Why It Seems Scarce, Why It Matters. Penguin.
VentureBeat. (2019, July 19). Why do 87% of data science projects never make it into production? Retrieved from VentureBeat: https://venturebeat.com/2019/07/19/why-do-87-of-data- science-projects-never-make-it-into-production/
1 In manufacturing, “list prices” are provided by CPQ/CRM or ERP systems, either set annually or calculated dynamically on a cost-plus basis. In freight transport, prices are dynamic and calculated based on cost-plus, using network management systems and delivery scenarios. A decision algorithm is applied before the involvement of commercial manager (before applying the regular “price waterfall” of discounts, rebates, etc.), at the stage of calculation.
Complementary forecasts for the end markets of freight transportation & logistics companies in Europe
to add value in making pricing and capacity decisions at your company.