
Capacity Management: How to Find Capacity When Demand Is Out of Control?
“Pricing/demand is not an issue for us these days, we just can’t find capacity” was the most typical phrase that we heard during 2022, speaking with managers of customers and prospects. The Transport industry was hit by a massive shortage of capacity, including drivers, trucks, vessels and every other asset.
It’s very likely that the same managers had earlier in their career complained about “too much capacity and the need to cut the capacity in order to keep the margin”. Behind these statements there is a common problem: limited focus on the end demand and pricing.
A simple fact is that the demand for transport changes and pricing is a potent tool for managing that demand. Sometimes, as in 2021, this change is extremely large. Paradoxically, the combination of cost, margin management and cost-plus pricing that are used by most transport companies create or exaggerate the capacity problem.
Doing things “right” makes it wrong: why do we run out of capacity?
Here is a simple example based on one route for a road transport company – XY logistics. In January, the price for the route is quoted at €800. The cost (whichever way it is calculated) is at €700 and the regular volume of transport is 500 shipments per month. Now assume an event (say the people stayed home due to a pandemic and decided to buy more goods) creates a gradual increase in demand.
The company notices increasing volumes from 500 to 650 in February through 930 in May (Table 1). Increasing volumes drive the revenues higher, so XY’s management is happy. However, the costs used in calculation do not change and the cost-plus pricing still gives the same price. Because of the bigger volume needed from suppliers (trucks, containers, drivers etc.), the costs begin to increase, but this is not picked up quickly for the pricing. Only late in May the management notices that the unit contribution margin has dropped and decides to increase the price to €950.
Table 1: Pricing, revenues and margins in case of increasing demand with cost-plus pricing.
| Month | Quoted Price |
Volume | Revenues(cost+) – price x volume | Cost | Unit Contribution Margin |
Gross Margin |
| Jan | 800 | 500 | 400,000 | 700 | 100 | 50,000 |
| Feb | 800 | 650 | 520,000 | 720 | 80 | 52,000 |
| Mar | 800 | 750 | 600,000 | 740 | 60 | 45,000 |
| Apr | 800 | 850 | 680,000 | 760 | 40 | 34,000 |
| May | 800 | 930 | 744,000 | 780 | 20 | 18,600 |
| June | 950 | 500 | 475,000 | 830 | 120 | 60,000 |
| Total | 3,419,000 | 259,600 |
At the same time, the purchasing department is trying to manage the rising costs and they know that the margins are under pressure, so they try to limit the cost increases. This creates an artificial capacity constraint – a situation when the company runs out of capacity because of the incorrect pricing.
Managing the demand (and earning more cash margin)
It is clear that the company’s focus on historic costs and cost-plus pricing limits its ability to bid for capacity from its suppliers (or invest in new capacity). One way to fix this issue would be to introduce a demand-driven component in the pricing (Intelligent Pricing) applied to price calculation at the end.
In this case, XY’s pricing engine captures the increasing demand early and begins to apply positive demand adjustment to the price (Table 2). The volume still increases due to much stronger demand, but not as much as in the cost-plus case. The unit contribution margin can increase, if the goal is to maximize the margin, or stay stable, if the goal is to keep a certain revenue. Costs are allowed to increase faster, which makes it easier to outbid the competition for capacity. The resulting gross margin for the period is considerably higher, while the capacity is more manageable.
Table 2: Pricing, revenues and margins in case of increasing demand with Intelligent Pricing
| Month | Quoted Price |
Volume | Revenues(cost+) | Cost | Unit Contribution Margin |
Gross Margin |
| Jan | 800 | 500 | 400,000 | 700 | 100 | 50,000 |
| Feb | 850 | 570 | 484,500 | 744 | 106 | 60,563 |
| Mar | 870 | 620 | 539,400 | 761 | 109 | 67,425 |
| Apr | 890 | 620 | 551,800 | 779 | 111 | 68,975 |
| May | 920 | 600 | 552,000 | 805 | 115 | 69,000 |
| June | 950 | 500 | 475,000 | 830 | 120 | 60,000 |
| Total | 3,002,700 | 375,963 |
Of course the assumption is that the company is able to anticipate the increasing demand. One way to do this is to monitor own volumes more carefully. But this may not yield the correct result, since the company’s volumes may be affected by competitive pressures, pricing or other factors. A more reliable way to gauge the market demand is to use external data (learn how).
Note that the revenues in the second case are lower than in the first case due to the lower volume. This is not necessarily the case with Intelligent Pricing, as the management may decide to target stable market share, but still improve margins and manage capacity better.
Another important point is that the Intelligent Pricing does not mean no tender contracts, as these have to be priced correctly during the renewal. In fact, with Intelligent Pricing companies are able to make even better margins by creating the optimal mix of tender vs. spot contracts.
This simple example is just an illustration of how the traditional pricing and margin management approach creates capacity problems when there are changes in demand. The same dynamic works when demand falls: companies attempt to keep prices high, the volume dries up hurting the cash margins. A correct course of action would be to begin cutting the prices to keep the volumes more stable. In essence, Intelligent Pricing helps the company to make money not with volumes, which is difficult and disruptive, but with prices.
But what about the customers?
Often companies present unfounded arguments against Intelligent Pricing, for instance that the customers would struggle to understand the prices or that the rest of the market prices cost-plus, so the company would lose market share if switched to intelligent pricing.
From the perspective of customers, Intelligent Pricing has huge benefits:
- The provider is able to be a more reliable partner for the best customers, as the company can always access capacity. Customers appreciate the reliability.
- The prices change gradually with small steps, rather than in big chunks, which is less acceptable to customers.
- When the demand shrinks, Intelligent Pricing results in greater market share. With increasing demand, Intelligent Pricing can maintain the market share. In both cases, the margins are higher, which results in more cash to invest and create a cost advantage compared to competition. In the longer term, the result is lower costs, higher market share and better margins.
- Better cash margin generation creates a cash reserve to outbid the competition for more assets if the strength in demand continues, or to sustain the organization if/when the demand dries up.
One added benefit for the sales department is that it is always easier to sell at the price that reflects the market demand.
Covid is over, why worry about capacity in the future?
It’s tempting to think that the Covid-driven change in supply-demand balance was a one-off event. But the changes in demand and supply, albeit smaller, have always been part of the transportation cycle. This is driven by capacity utilization in the broader economy (Figure 1).
Figure 1: Change in capacity utilization compared to the average, Euro Area, Source: FRED, ClearD3 calculations
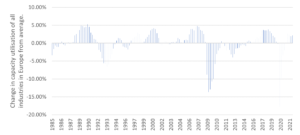
What this graph suggests is that in an average year there is a good chance of a change in demand by 5-10% either way.
Based on our calculations, by ignoring the above in the pricing phase, transport companies currently earn 4-6% less gross margin than they otherwise could with exact same assets. They also create capacity stresses and shortages, while the most loyal customers have to be turned away or put on hold.
Complementary forecasts for the end markets of freight transportation & logistics companies in Europe
to add value in making pricing and capacity decisions at your company.